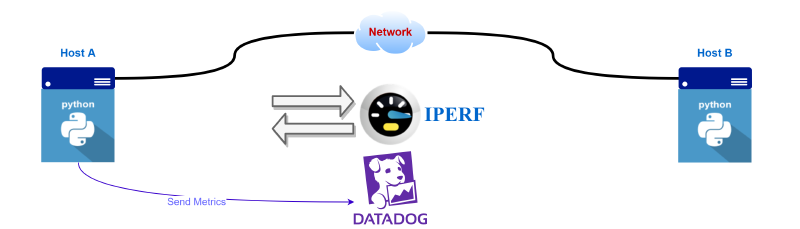
The best way for a Network Engineer to grasp automation is to begin by coding a simple problem that they encounter. We often use IPERF to measure the bandwidth performance of a network path. With a few lines of python code, we can automate this task and graph the data via DataDog for historical reference.
The End Result
Nobody likes to read through pages of text and images to get to the money shot. So here it is…
DataDog Graph
Graph of hourly iperf3 tests:

Python Code
# Script to run iperf3 test to measure bandwidth to remote site.
# Runs in reverse mode to measure both ingress and egress bandwidth
# Sends avg bandwidth metric to Datadog as a custom gauge metric
# Its suggested you run this script as a cron job on a regular hourly interval

from datadog import initialize, statsd
import time
import iperf3
import os

# Set vars
# Remote iperf server IP
remote_site = '<enter remote host IP here>'
# Datadog API Key
api_key = '<enter dd api key here>'
# How long to run iperf3 test in seconds
test_duration = 20

# Set DD options for statsd init
options = {
    'statsd_host': '127.0.0.1',
    'statsd_port': 8125,
    'api_key': api_key
}
initialize(**options)

# Set Iperf Client Options
# Run 10 parallel streams on port 5201 for duration w/ reverse
client = iperf3.Client()
client.server_hostname = remote_site
client.zerocopy = True
client.verbose = False
client.reverse = True
client.port = 5201
client.num_streams = 10
client.duration = int(test_duration)
client.bandwidth = 1000000000

# Run iperf3 test
result = client.run()

# extract relevant data
sent_mbps = int(result.sent_Mbps)
received_mbps = int(result.received_Mbps)

# send Metrics to DD and add some tags for classification in DD GUI
# send bandwidth metric - egress mbps
statsd.gauge('iperf3.test.mbps.egress', sent_mbps, tags=["team_name:your_team", "team_app:iperf"])
# send bandwidth metric - ingress mbps
statsd.gauge('iperf3.test.mbps.ingress', received_mbps, tags=["team_name:your_team", "team_app:iperf"])
The Process
If you’re still here, let’s get into the details…
Setup
- Spin up two Linux Hosts (HostA and HostB)
- Install Python3 –>
yum install python3 - Install IPERF3 –>
yum install iperf3 - Install iPerf3 Python Wrapper –>
pip install iperf3
- Install Python3 –>
- Setup a DataDog Account and API Key
- Graphing the metrics is optional. Alternatively, we can save results to local disk.
iperf3 Server
Choose one of your hosts to be your always-on iperf3 server and setup an iperf3 service in systemd
- For Centos Linux:
- cd
/etc/systemd/system/ - Create a file called iperf3.service
- Contents:
- cd
# Centos Server file to run iperf3 service on startup.
# This server acts as the iperf 'receiver' for speed testing.
# /etc/systemd/system/iperf3.service
# User service: $HOME/.config/systemd/user/iperf3.service

[Unit]
Description=iperf3 server
After=syslog.target network.target auditd.service

[Service]
ExecStart=/usr/bin/iperf3 -s

[Install]
WantedBy=multi-user.target
- enable the service to run at startup:
systemctl enable iperf3.service - start the iperf3 service:
systemctl start iperf3.service - verify the service is running:
systemctl status iperf3.serviceorps aux | grep iperf
iperf3 Client
Begin testing the iperf3 service by creating a simple python script on the Client HostA
- Create
iperf-dd-metrics-test.py:
import iperf3

# Set vars
# Remote iperf server IP
remote_site = 'ip of server goes here'
# How long to run iperf3 test in seconds
test_duration = 10

# Set Iperf Client Options
# Run 10 parallel streams on port 5201 for duration w/ reverse
client = iperf3.Client()
client.server_hostname = remote_site
client.zerocopy = True
client.verbose = False
client.reverse = True
client.port = 5201
client.num_streams = 10
client.duration = int(test_duration)
client.bandwidth = 1000000000

# Run iperf3 test
result = client.run()

# extract relevant data
sent_mbps = int(result.sent_Mbps)
received_mbps = int(result.received_Mbps)

print('sent_mbps: ')
print(sent_mbps)
print('received_mbps: ')
print(received_mbps)
- run the file:
# python3 iperf-dd-metrics-test.py:- results:
sent_mbps:
966
received_mbps:
959
Now we have a fully functioning iperf3 client and server setup.
Sending Metrics to DataDog
DataDog has a python library to allow us to send the speed test results up to DD
- Import the library and initialize options:
from datadog import initialize, statsd

# Datadog API Key
api_key = os.getenv('DD_API_KEY')

# Set DD options for statsd init
options = {
    'statsd_host': '127.0.0.1',
    'statsd_port': 8125,
    'api_key': api_key
}
initialize(**options)

# send Metrics to DD and add some tags for classification in DD GUI
# send bandwidth metric - egress mbps
statsd.gauge('iperf3.test.mbps.egress', sent_mbps, tags=["team_name:your_team", "team_app:iperf"])
# send bandwidth metric - ingress mbps
statsd.gauge('iperf3.test.mbps.ingress', received_mbps, tags=["team_name:your_team", "team_app:iperf"])
Full Script and Crontab
Put the two pieces of the script together and you get the end result — iperf-dd-metrics.py
Use crontab to continuously run the script in periodic intervals.
# Example of job definition:
# .---------------- minute (0 - 59)
# |  .------------- hour (0 - 23)
# |  |  .---------- day of month (1 - 31)
# |  |  |  .------- month (1 - 12) OR jan,feb,mar,apr ...
# |  |  |  |  .---- day of week (0 - 6) (Sunday=0 or 7) OR sun,mon,tue,wed,thu,fri,sat
# |  |  |  |  |
# *  *  *  *  * user-name  command to be executed
20 * * * * root /usr/bin/python3 /home/iperf-python/iperf-dd-metrics.py
The above job will run every hour on the 20th minute of the hour forever
Visualizing the Data
The metrics that are being sent to DataDog need to be graphed on a dashboard
- Logon to DataDog and go to Metrics –> Explorer
- Search
iperf3 - Find you metrics
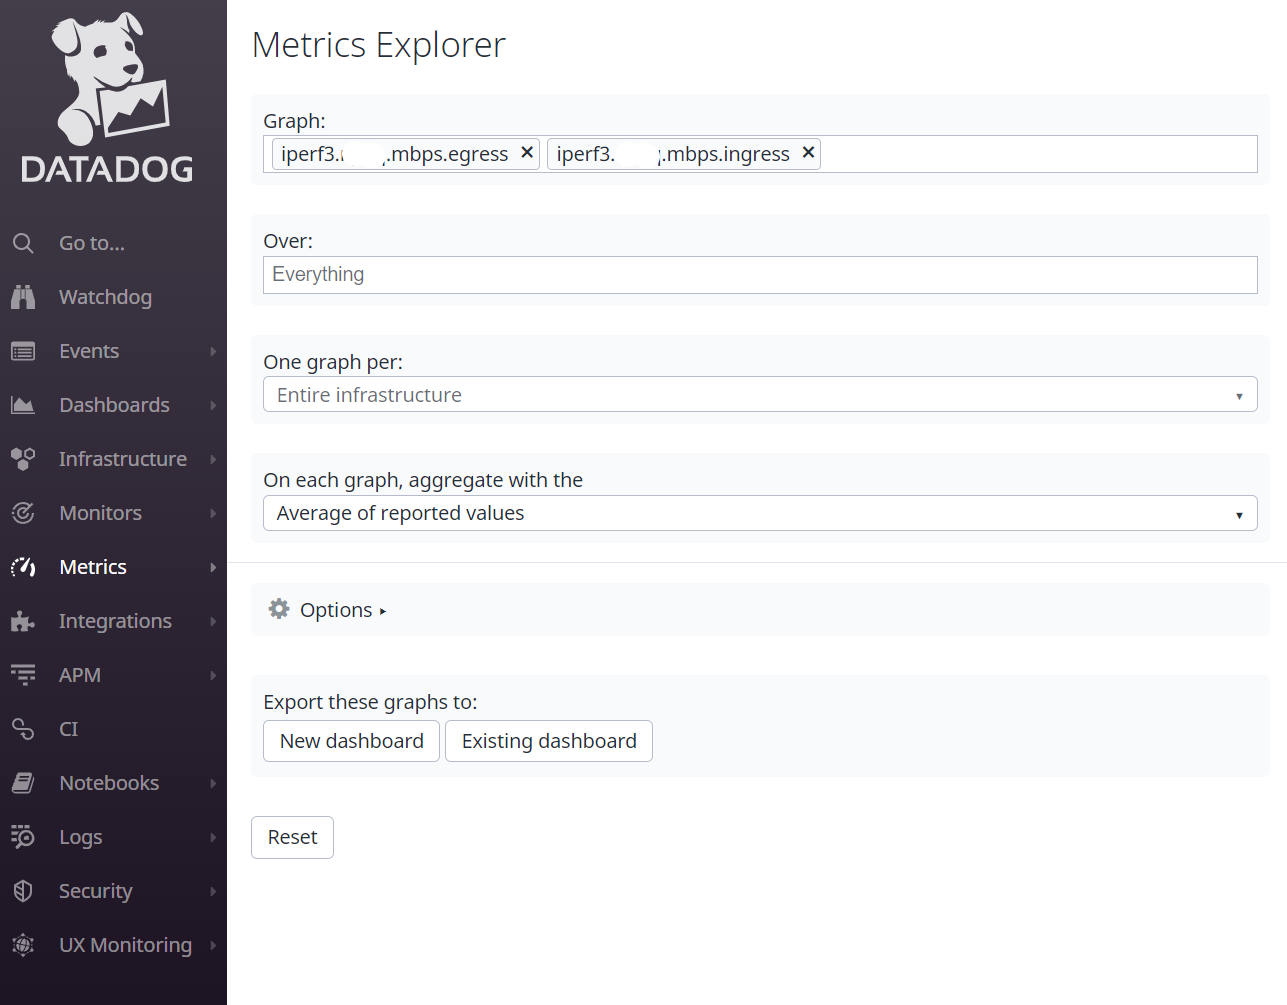
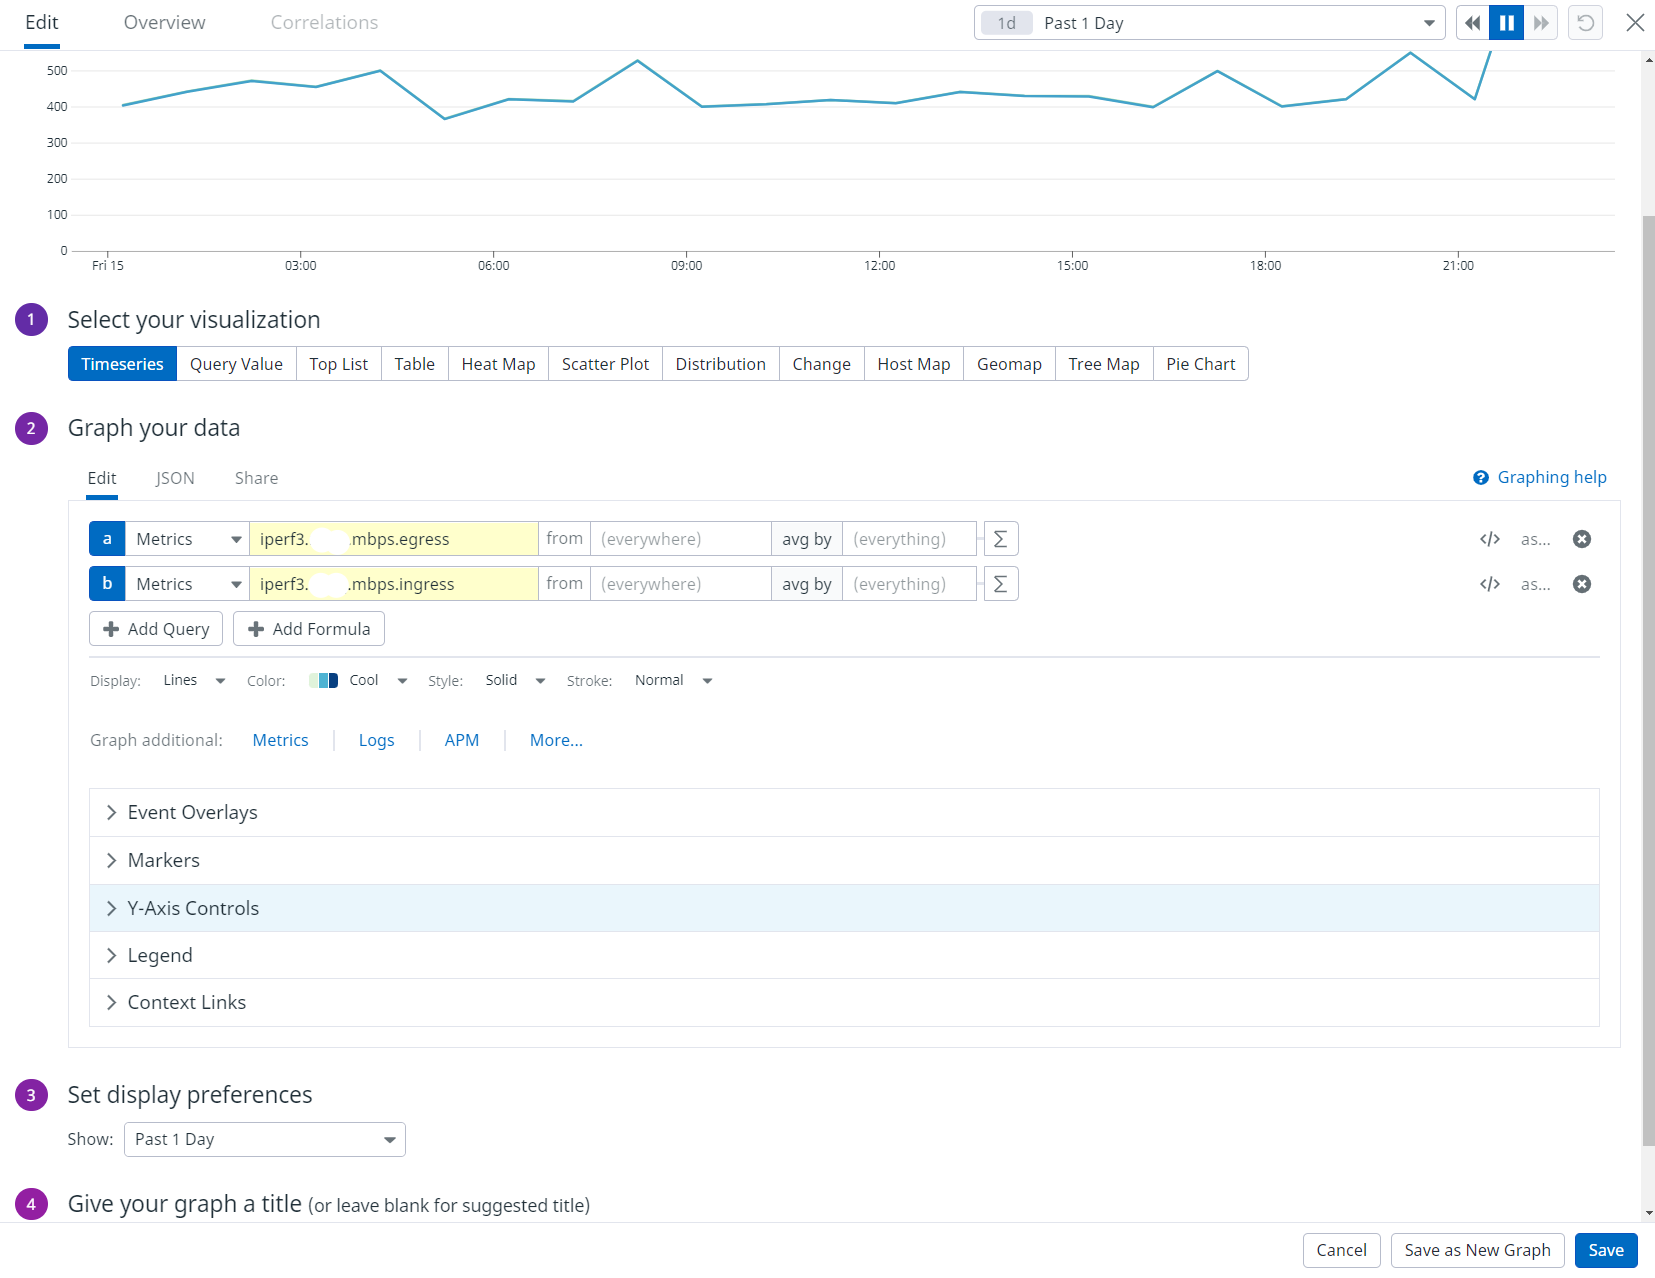
- Create a timeseries graph
- Graph both Egress and Ingress Metrics as A and B respectively
- Set your Y-Axis to desired MAX setting (999 in my case)
- Give your graph a title
Final Thoughts
This scenario is a good way to get started with network automation. However, it can be iterated and improved by:
- Adding more metrics:
- Jitter
- Packet Loss
- UDP Testing
- Add exception handling
Feel free to contact me on twitter or comment below if you need help. Cheers!